RidePy Tutorial 1: Basics
This tutorial covers the basics of using RidePy: Setting up a simulation, running it, and doing basic analytics on it.
Configuring the simulation and supplying initial values
Choosing a simulation space
The first important step for performing a RidePy simulation is the choice of the physical space that the simulations should be run on. For this example, we choose the Euclidean 2D TransportSpace from the util package.
from ridepy.util.spaces import Euclidean2D

space = Euclidean2D()
Choosing a way of generating requests for transportation
The basis for RidePy simulations are TransportationRequests. Each of these consists of:
origindestinationpickup_timewindow_minpickup_timewindow_maxdelivery_timewindow_mindelivery_timewindow_max
To generate these TransportationRequests, we will use the RandomRequestGenerator from the util package:
from ridepy.util.request_generators import RandomRequestGenerator

rg = RandomRequestGenerator(
    rate=10,
    max_pickup_delay=3,
    max_delivery_delay_rel=1.9,
    space=space,
    seed=42,
)
Setting up a fleet of vehicles
RidePy manages a fleet of vehicles using a FleetState object. It consumes a dictionary of initial_locations which maps arbitrary vehicle ids to their starting position in the simulation. The number of vehicles to set up is inferred from the number of entries in the initial_conditions dict.
In addition, the fleet state needs to know about the space used for the simulation, and about the desired Dispatcher. The dispatcher function contains the algorithm that determines how stops to serve incoming requests are scheduled. In this case, we use the included BruteForceTotalTravelTimeMinimizingDispatcher.
n_buses = 50
initial_location = (0, 0)
from ridepy.fleet_state import SlowSimpleFleetState
from ridepy.vehicle_state import VehicleState
from ridepy.util.dispatchers import BruteForceTotalTravelTimeMinimizingDispatcher

fs = SlowSimpleFleetState(
    initial_locations={vehicle_id: initial_location for vehicle_id in range(n_buses)},
    seat_capacities=8,
    space=space,
    dispatcher=BruteForceTotalTravelTimeMinimizingDispatcher(),
    vehicle_state_class=VehicleState,
)
Performing a simulation
To run the simulation we first take a slice of, in this case, 100 random requests out of the request generator we set up above…
import itertools as it

transportation_requests = it.islice(rg, 100)
…and feed them into FleetState.simulate. Note that both of these operations use iterators and no computation actually happens until the iterators are exhausted. For FleetState.simulate, this happens when we cast its output into a Python list. In the case of the request generator, the output is an iterator of TransportationRequest objects, in the case of the simulate method an iterator of Event objects. These events describe e.g. that a request was accepted or that a “customer” or “rider” (represented by its TransportationRequest) was picked up or delivered to her destination.
# exhaust the simulator's iterator
events = list(fs.simulate(transportation_requests))
Processing the results
Running the simulations leaves us with a bunch of the events described above. This means that the raw output of the simulator looks something like this:
events[200:203]
[{'event_type': 'RequestAcceptanceEvent',
  'timestamp': 4.229722339631084,
  'request_id': 49,
  'origin': (0.5503253124498481, 0.05058832952488124),
  'destination': (0.9992824684127266, 0.8360275850799519),
  'pickup_timewindow_min': 4.229722339631084,
  'pickup_timewindow_max': 7.229722339631084,
  'delivery_timewindow_min': 4.229722339631084,
  'delivery_timewindow_max': 6.853344745923743},
 {'event_type': 'PickupEvent',
  'timestamp': 4.331264366244138,
  'request_id': 33,
  'vehicle_id': 1},
 {'event_type': 'DeliveryEvent',
  'timestamp': 4.338826458385998,
  'request_id': 35,
  'vehicle_id': 3}]
Obtaining all vehicle stops and requests
To directly gain some insights from these raw events, we use the get_stops_and_requests function from the analytics package. It consumes the raw events (and the simulation space) and creates two pandas dataframes: stops, and requests.
from ridepy.util.analytics import get_stops_and_requests

stops, requests = get_stops_and_requests(events=events, space=space)
stops contains the stoplists (retrospective “schedules”) of all vehicles operated during the simulation:
stops.iloc[5]
timestamp                                           1.441522
delta_occupancy                                          1.0
request_id                                                11
state_duration                                      0.049913
occupancy                                                3.0
location           (0.0797919769236275, 0.23279088636103018)
dist_to_next                                        0.049913
time_to_next                                        0.049913
Name: (0.0, 5), dtype: object
requests on the other hand contains all requests that we submitted by the request generator, along with detailed information about their status and service properties:
requests.iloc[5]
source     quantity
accepted   delivery_timewindow_max                                     2.678348
           delivery_timewindow_min                                      0.60483
           destination                (0.3402505165179919, 0.15547949981178155)
           origin                      (0.8058192518328079, 0.6981393949882269)
           pickup_timewindow_max                                        3.60483
           pickup_timewindow_min                                        0.60483
           timestamp                                                    0.60483
inferred   relative_travel_time                                        1.714583
           travel_time                                                 1.225938
           waiting_time                                                0.815852
rejected   timestamp                                                        NaN
serviced   timestamp_dropoff                                           2.646619
           timestamp_pickup                                            1.420682
           vehicle_id                                                       1.0
submitted  delivery_timewindow_max                                     2.678348
           delivery_timewindow_min                                      0.60483
           destination                (0.3402505165179919, 0.15547949981178155)
           direct_travel_distance                                      0.715006
           direct_travel_time                                          0.715006
           origin                      (0.8058192518328079, 0.6981393949882269)
           pickup_timewindow_max                                        3.60483
           pickup_timewindow_min                                        0.60483
           timestamp                                                    0.60483
Name: 5, dtype: object
Further Analyzing the results
Using the stops and requests dataframes, it’s now straightforward to analyze the simulation run further.
First, import some appropriate tooling:
%matplotlib inline

import pandas as pd
import numpy as np
import matplotlib.pyplot as plt
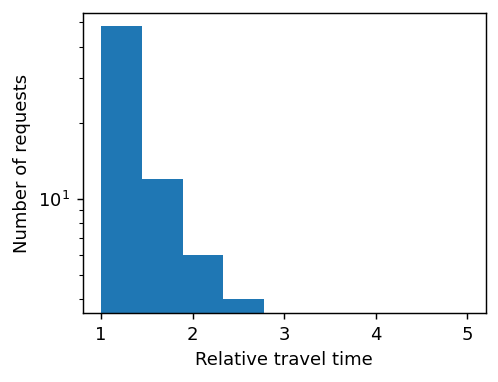
Relative travel time distribution
For example, we may obtain the distribution of the relative travel times (travel time using the service, compared to the direct trip distance)…
fig, ax = plt.subplots(figsize=(4,3), dpi=130)
requests[("inferred", "relative_travel_time")].hist(bins=np.r_[1:5:10j], ax=ax)
ax.grid(False)
ax.set_xlabel('Relative travel time')
ax.set_ylabel('Number of requests')
ax.set_yscale("log")
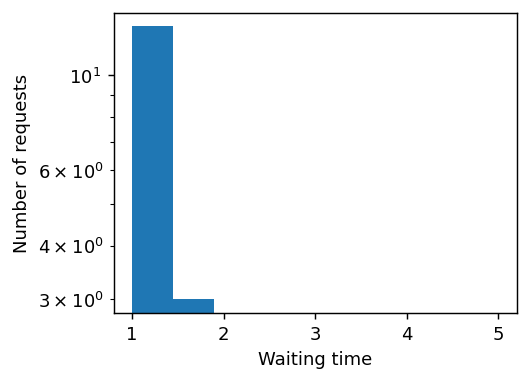
Waiting time distribution
… or of the waiting times (time between request submission and pick-up).
fig, ax = plt.subplots(figsize=(4,3), dpi=130)
requests[("inferred", "waiting_time")].hist(bins=np.r_[1:5:10j], ax=ax)
ax.grid(False)
ax.set_xlabel('Waiting time')
ax.set_ylabel('Number of requests')
ax.set_yscale("log")